Integrating Detailed Kubernetes Networking Flow Logs in CloudWatch
Now that we have policies installed, and traffic being generated in the cluster, we can look at the CloudWatch integration that TSCE provides.
We’re assuming that you have run through both the Calico section of this tutorial and the first part of the TSCE section. If you skipped the Calico section, please go back and run through that as well, as we are relying on the synthetic applications used in the Calico examples to generate flowlogs in CloudWatch.
Selecting out cluster in CloudWatch
You need to get the clusterID of the EKS cluster. To do that, run the following command:
$ kubectl get clusterinformation default -o yaml --kubeconfig=<your kubeconfig> | grep GUID
 clusterGUID: 6af4b853f8fa484b9870a95ff5102e96
In the cloud9 shell, go to the AWS dashboard, and select the Cloudwatch service.
Viewing and graphing metrics
Go to the metrics section, and select all of the metrics being reported by your clusterID. See the screenshot below
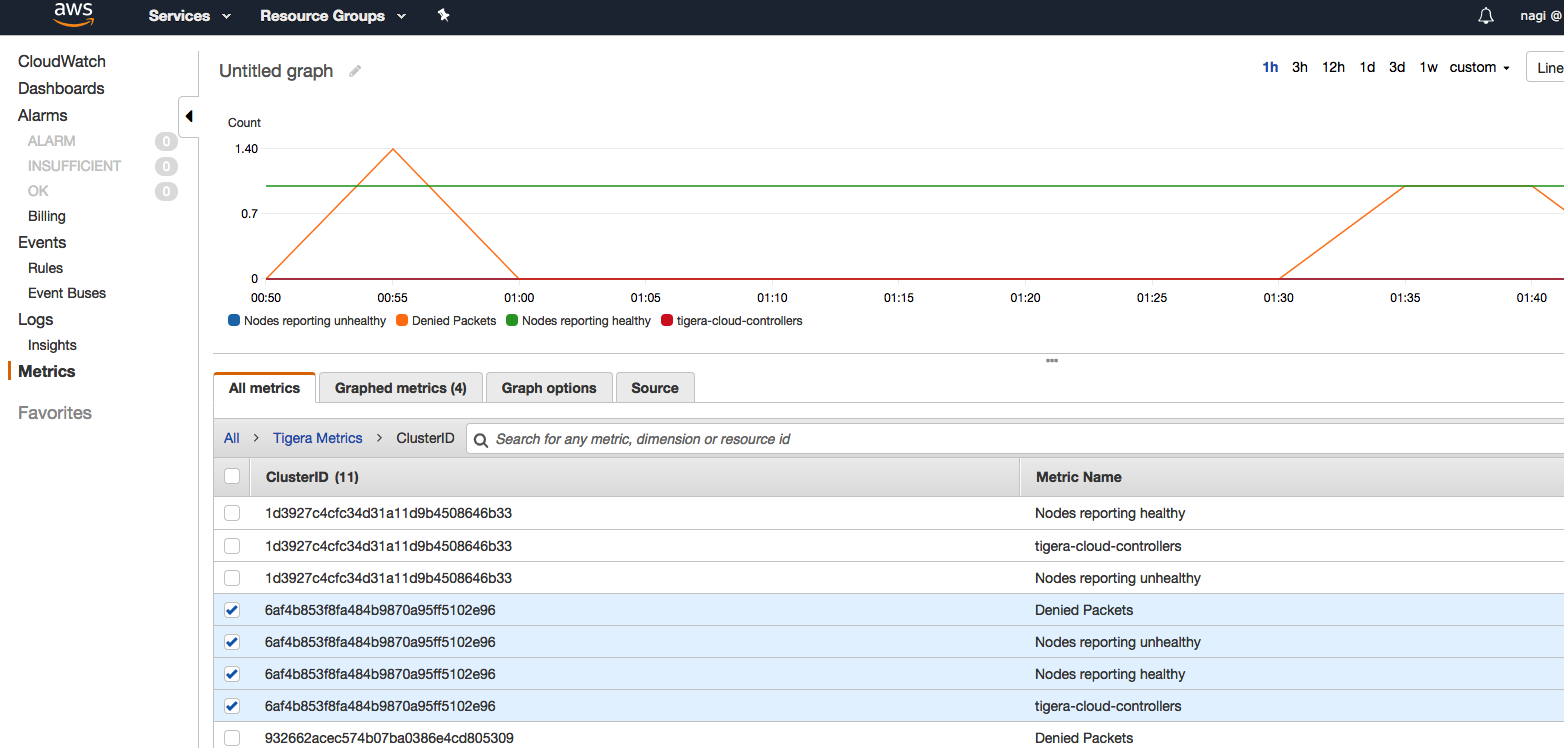
Just as in the screenshot, you should now see CloudWatch graphing various statistics such as denied packets, unhealthy nodes, etc.
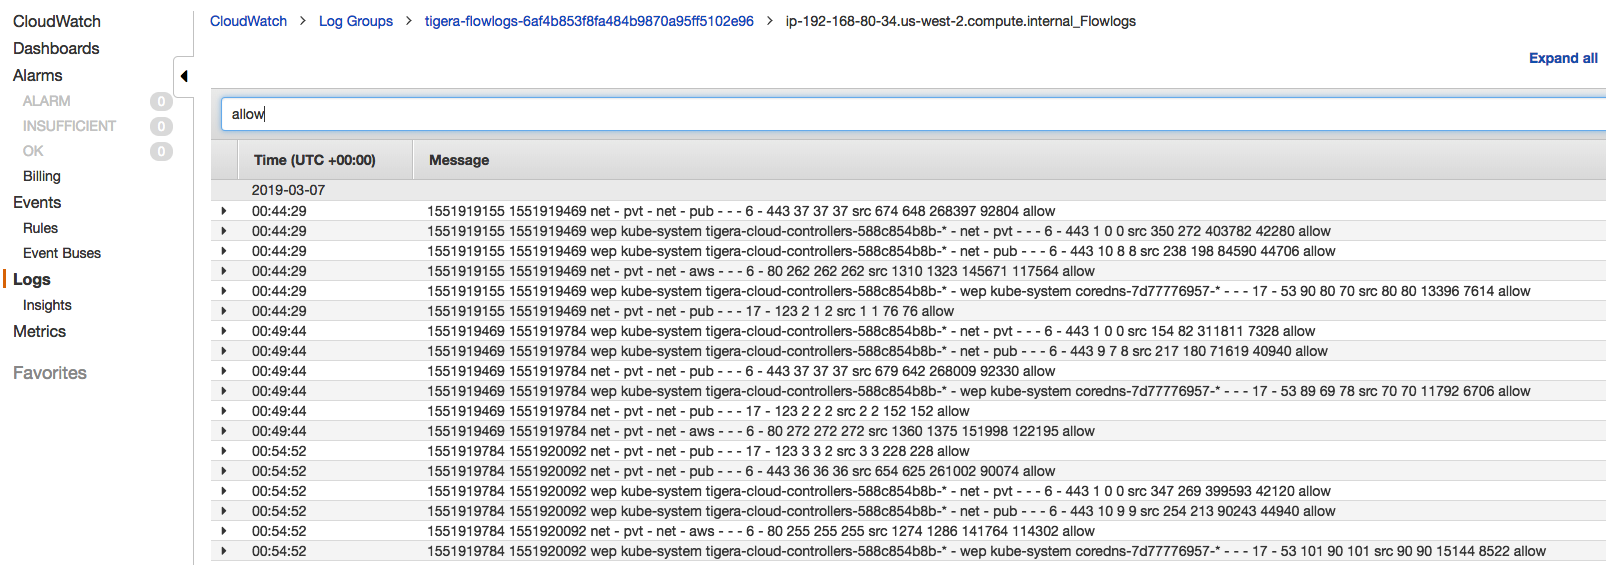
Viewing the flow logs
Similarly, you can see the actual flow logs by switching from the Metrics to the Logs view, as shown below