Configure CloudWatch Logs and Kibana
Configure CloudWatch Logs Subscription
CloudWatch Logs can be delivered to other services such as Amazon Elasticsearch for custom processing. This can be achieved by subscribing to a real-time feed of log events. A subscription filter defines the filter pattern to use for filtering which log events gets delivered to Elasticsearch, as well as information about where to send matching log events to.
In this section, we’ll subscribe to the CloudWatch log events from the fluent-cloudwatch stream from the eks/eksworkshop-eksctl log group. This feed will be streamed to the Elasticsearch cluster.
Original instructions for this are available at:
http://docs.aws.amazon.com/AmazonCloudWatch/latest/logs/CWL_ES_Stream.html
mkdir ~/environment/iam_policy/
cat <<EoF > ~/environment/iam_policy/lambda.json
{
   "Version": "2012-10-17",
   "Statement": [
   {
     "Effect": "Allow",
     "Principal": {
        "Service": "lambda.amazonaws.com"
     },
   "Action": "sts:AssumeRole"
   }
 ]
}
EoF

aws iam create-role --role-name lambda_basic_execution --assume-role-policy-document file://~/environment/iam_policy/lambda.json

aws iam attach-role-policy --role-name lambda_basic_execution --policy-arn arn:aws:iam::aws:policy/service-role/AWSLambdaBasicExecutionRole
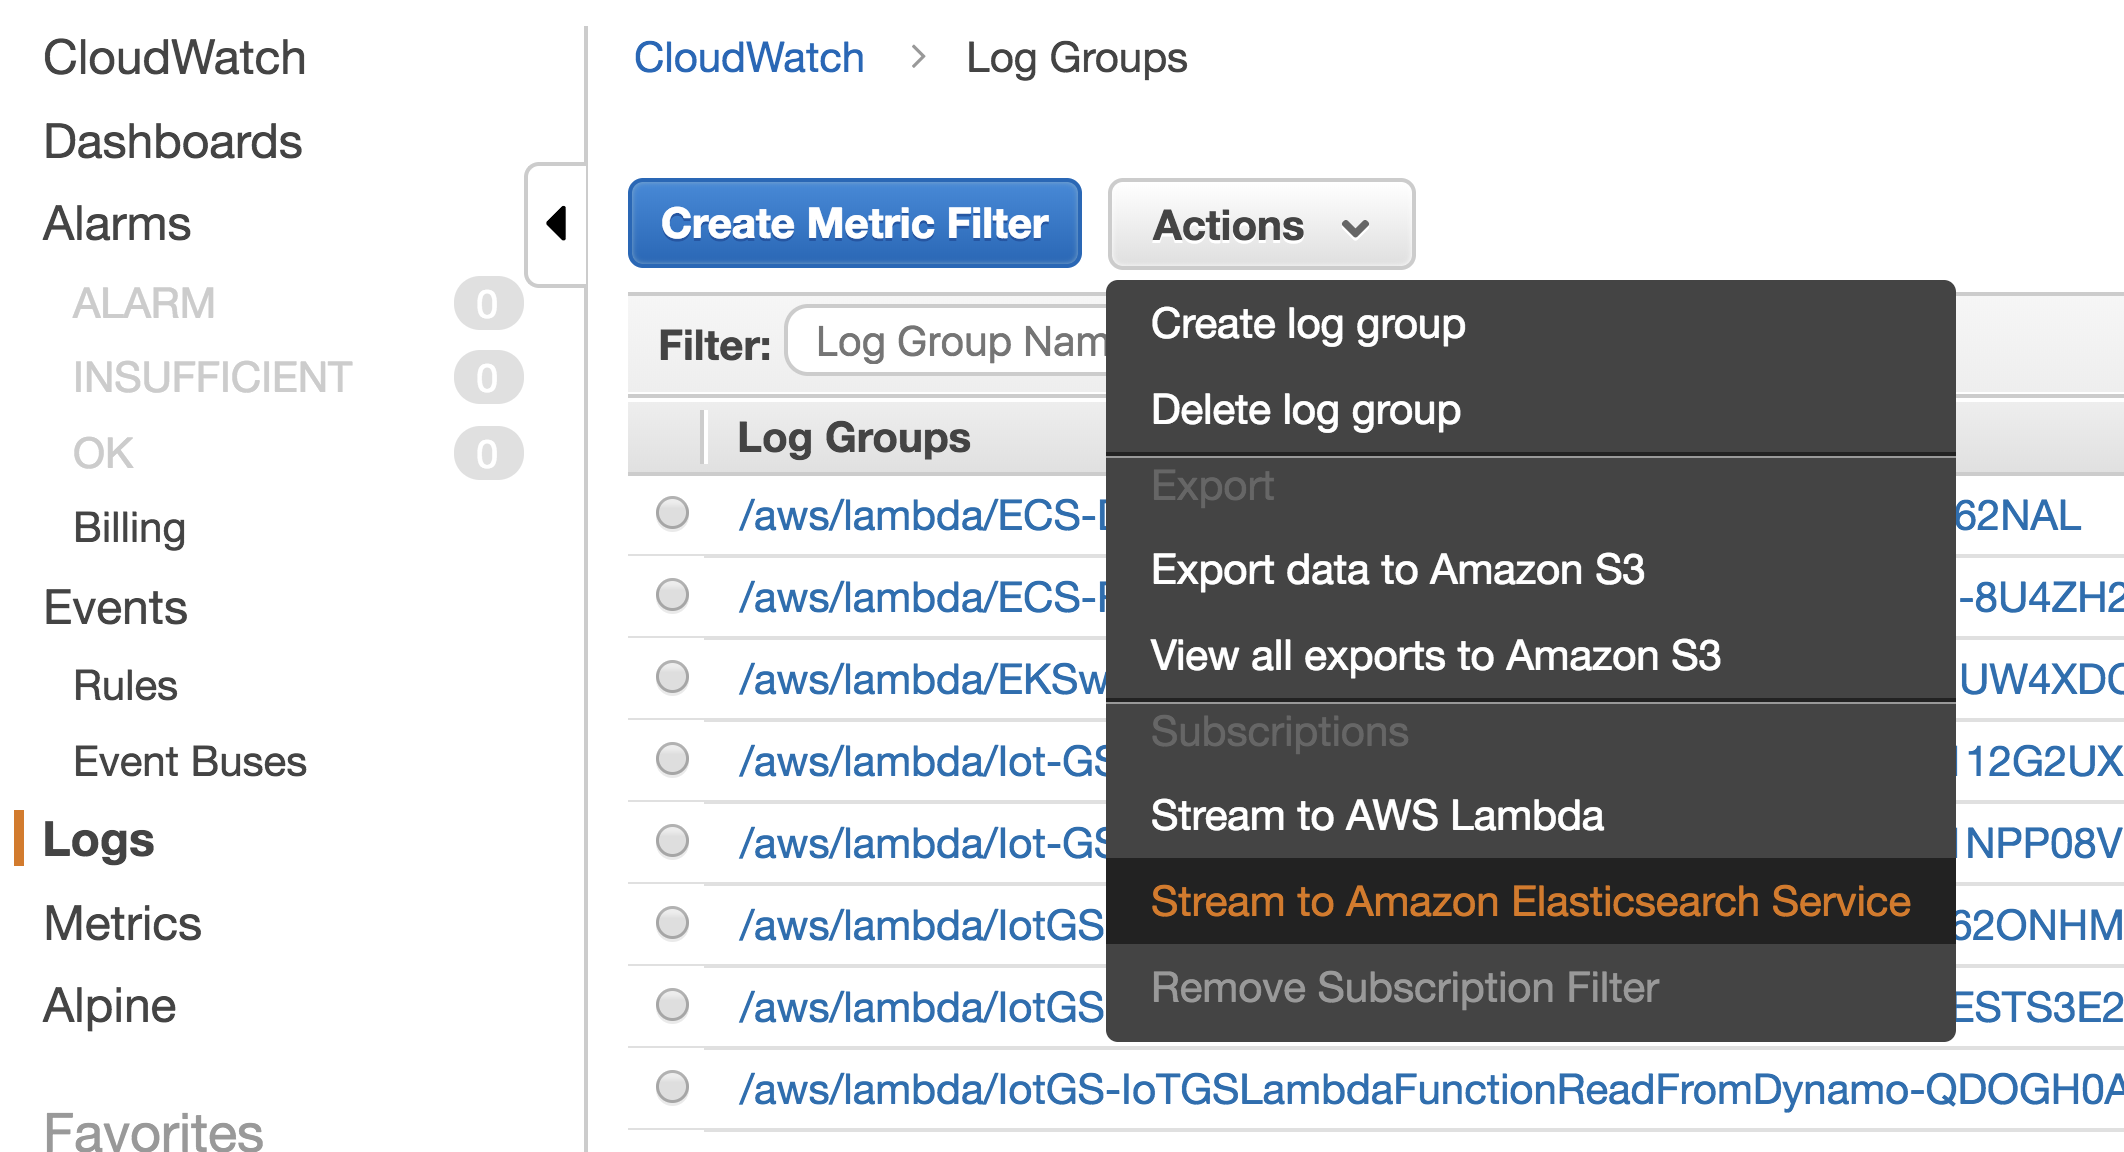
Go to the CloudWatch Logs console
Select the log group /eks/eksworkshop-eksctl/containers. Click on Actions and select Stream to Amazon ElasticSearch Service.
Select the ElasticSearch Cluster kubernetes-logs and IAM role lambda_basic_execution
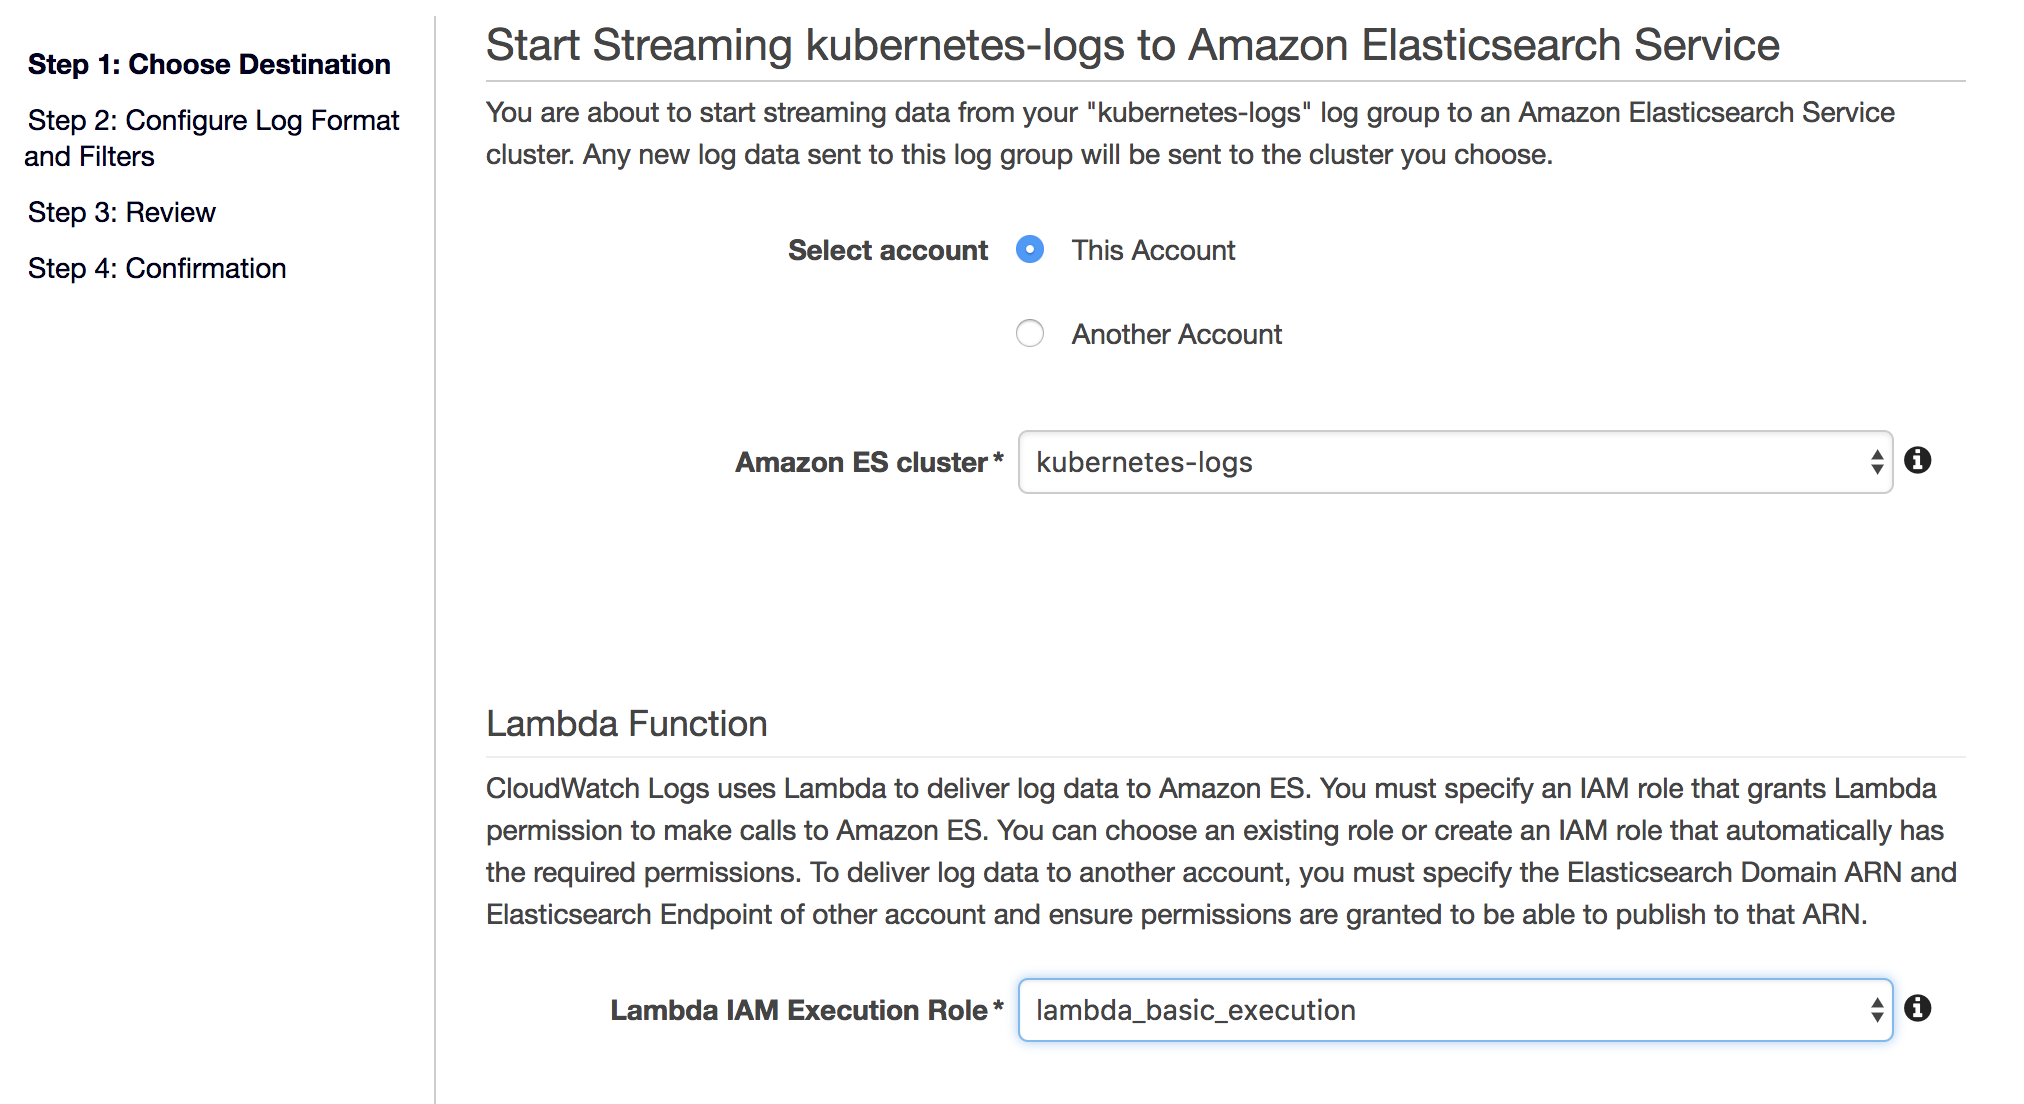
Click Next
Select Common Log Format and click Next
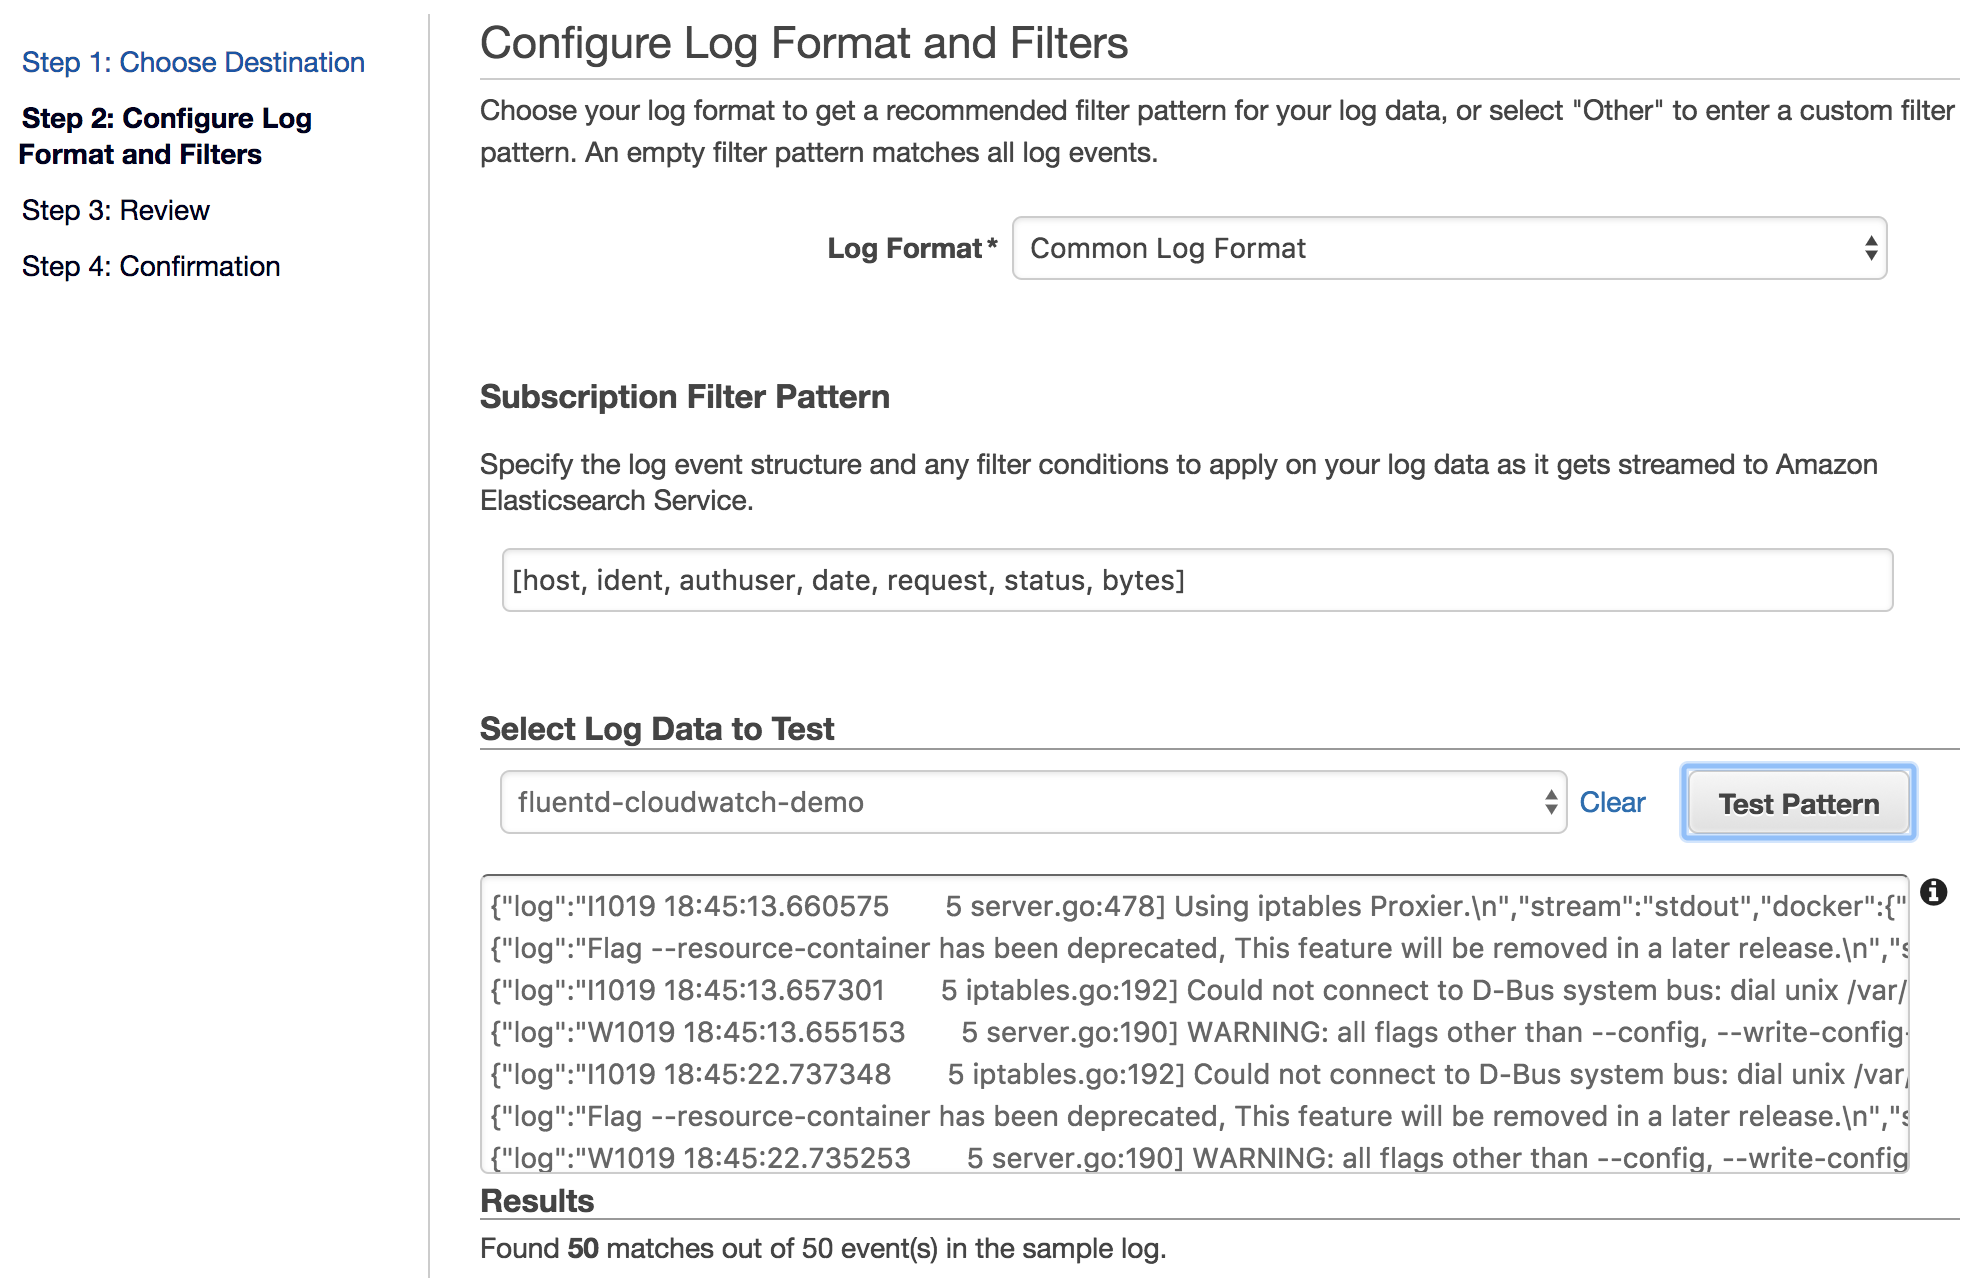
Review the configuration. Click Next and then Start Streaming
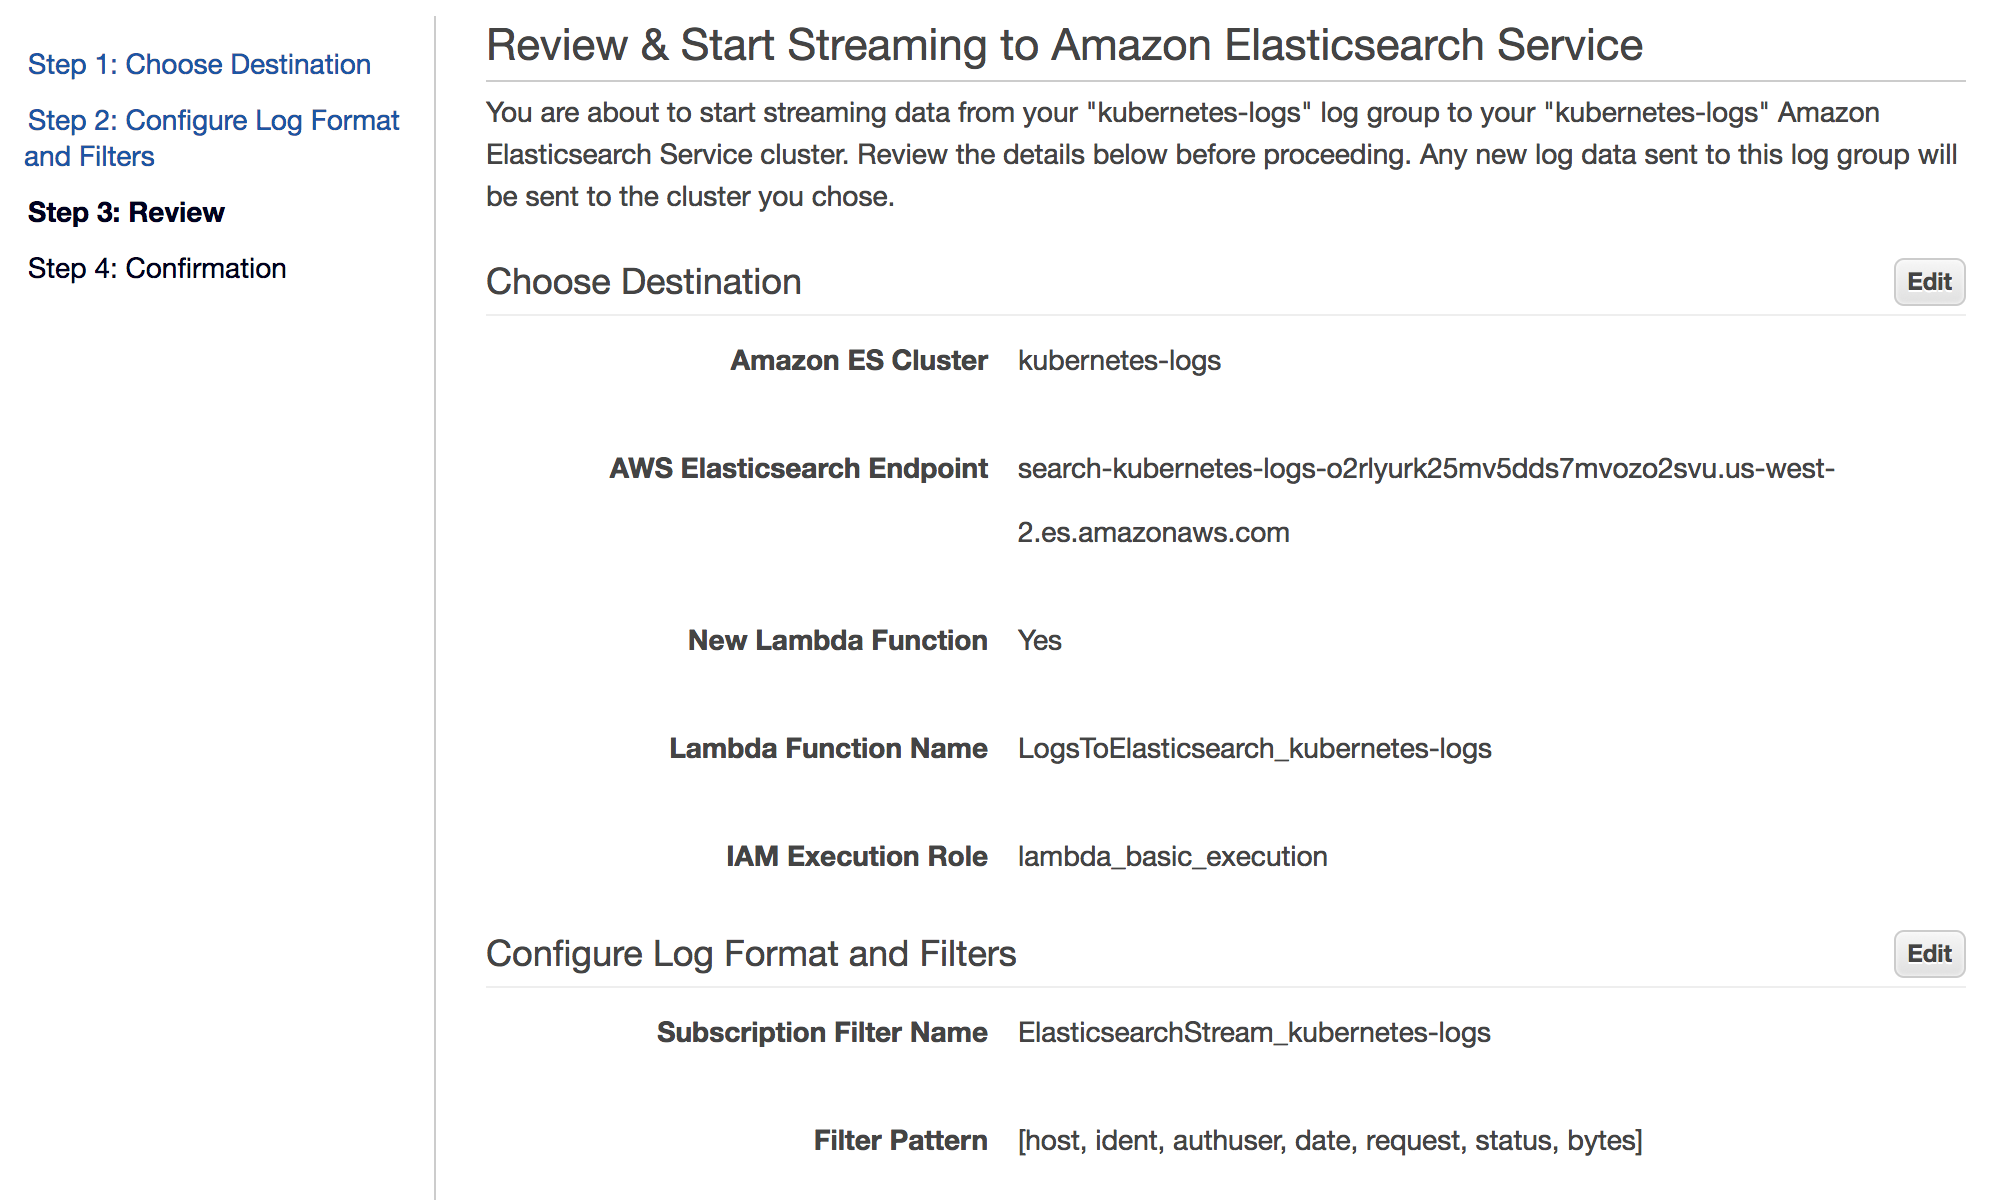
Cloudwatch page is refreshed to show that the filter was successfully created
Configure Kibana
In Amazon Elasticsearch console, select the kubernetes-logs under My domains
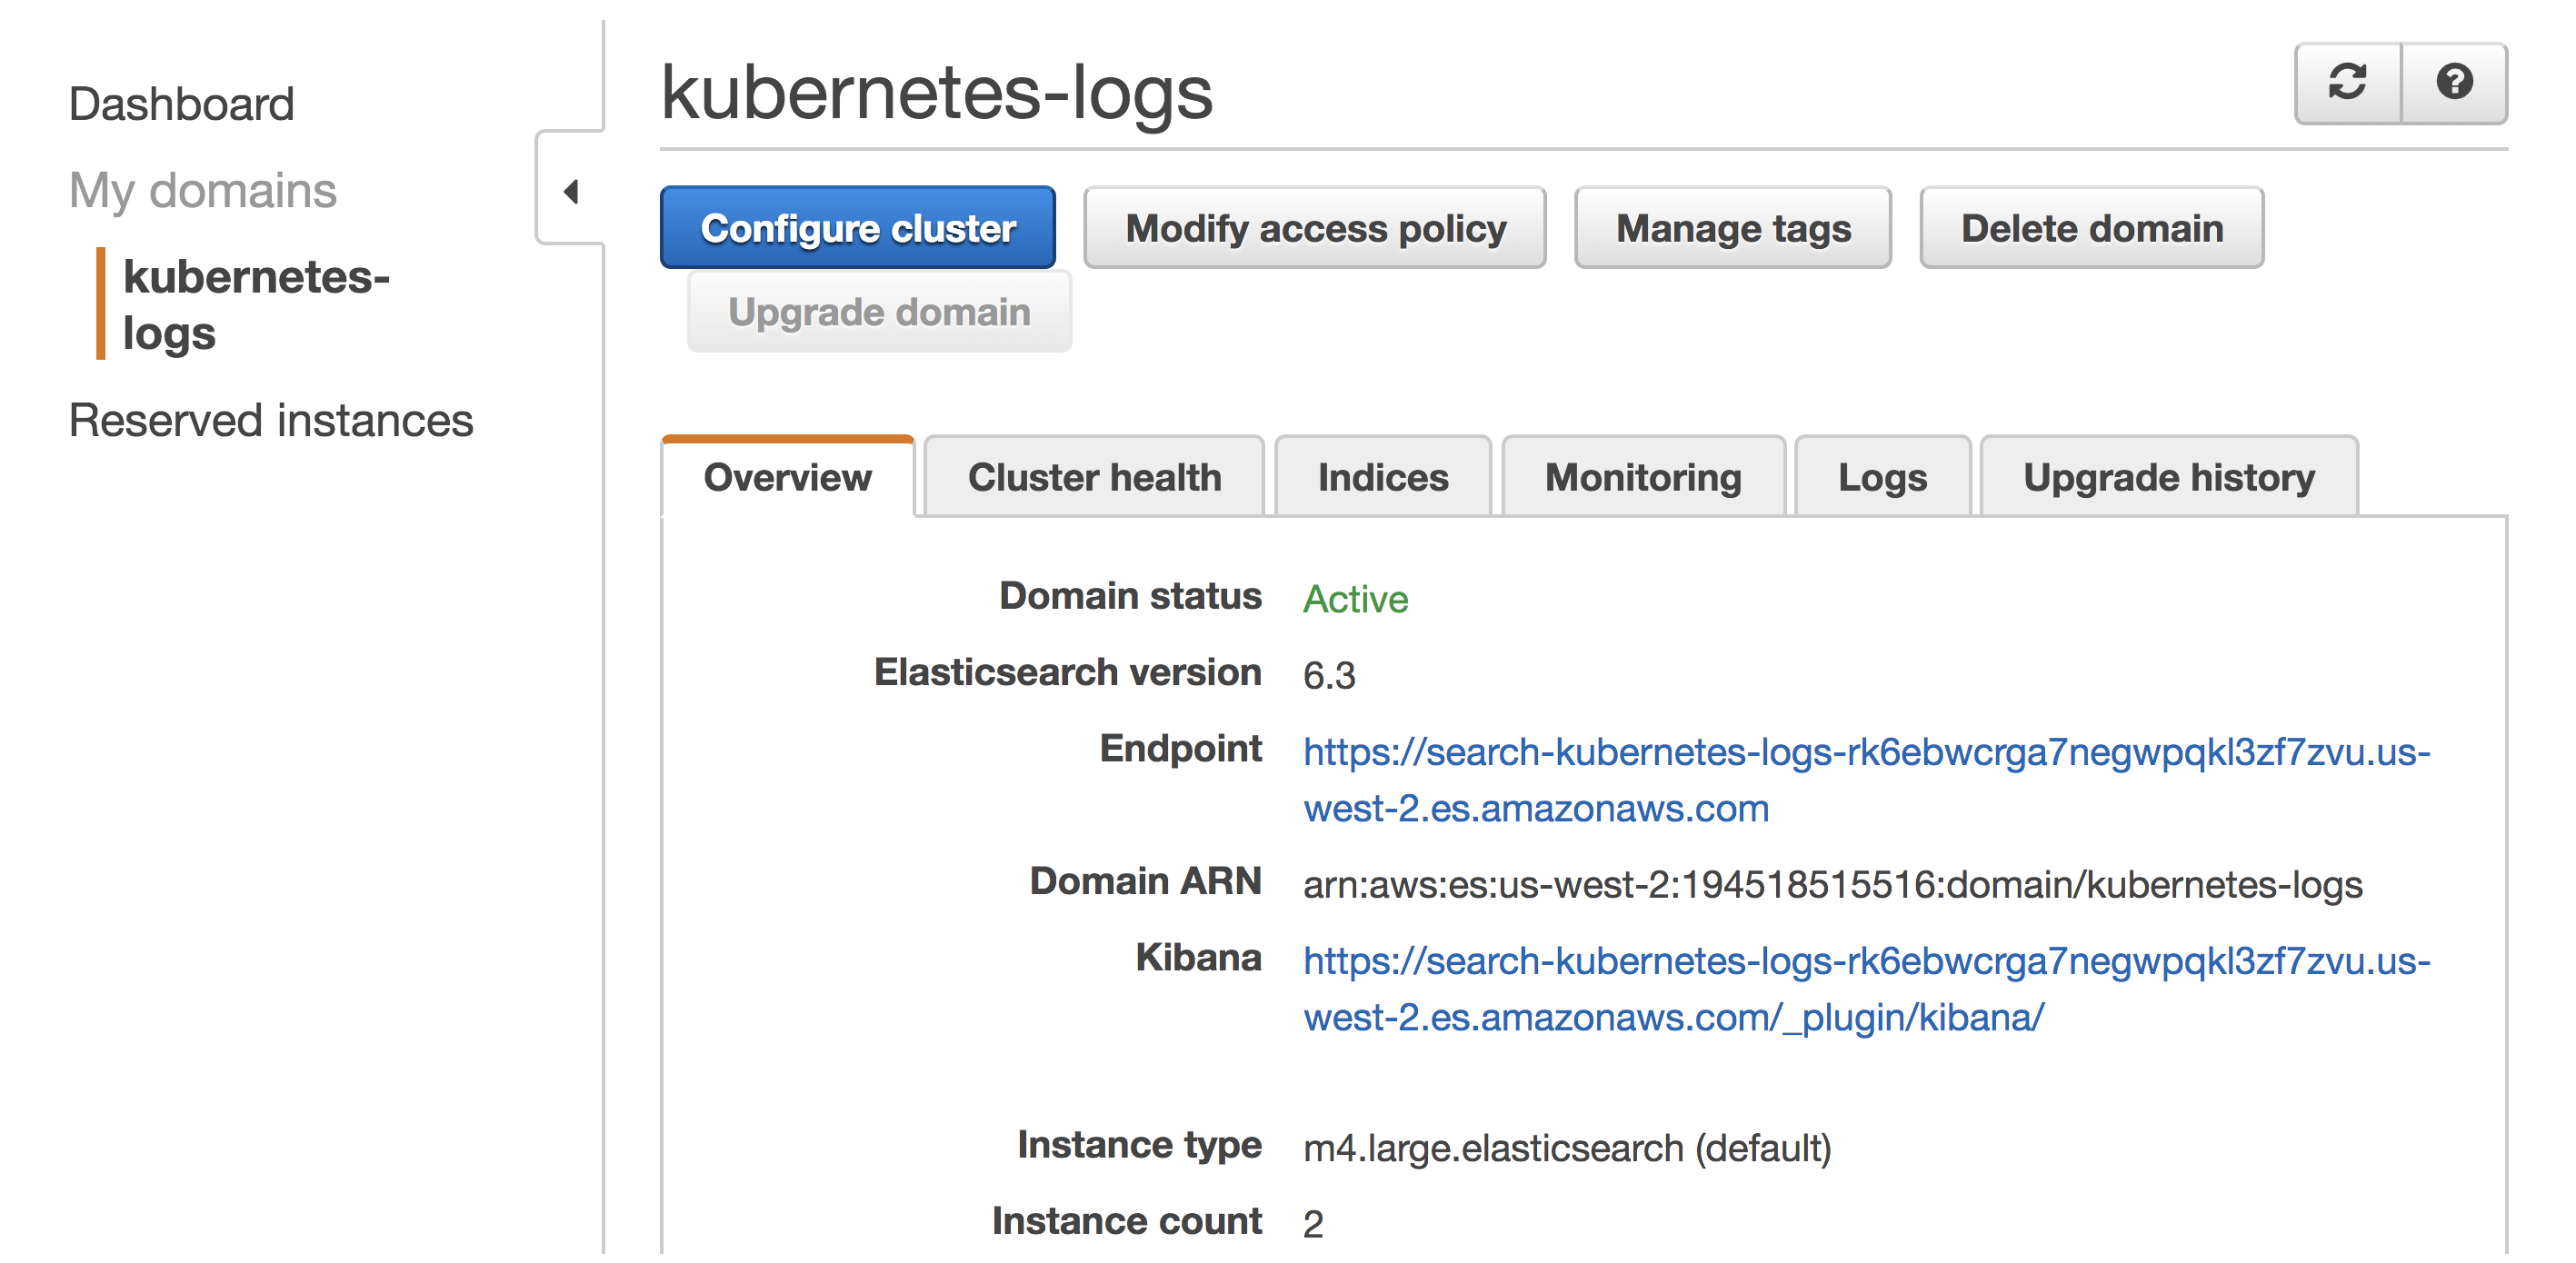
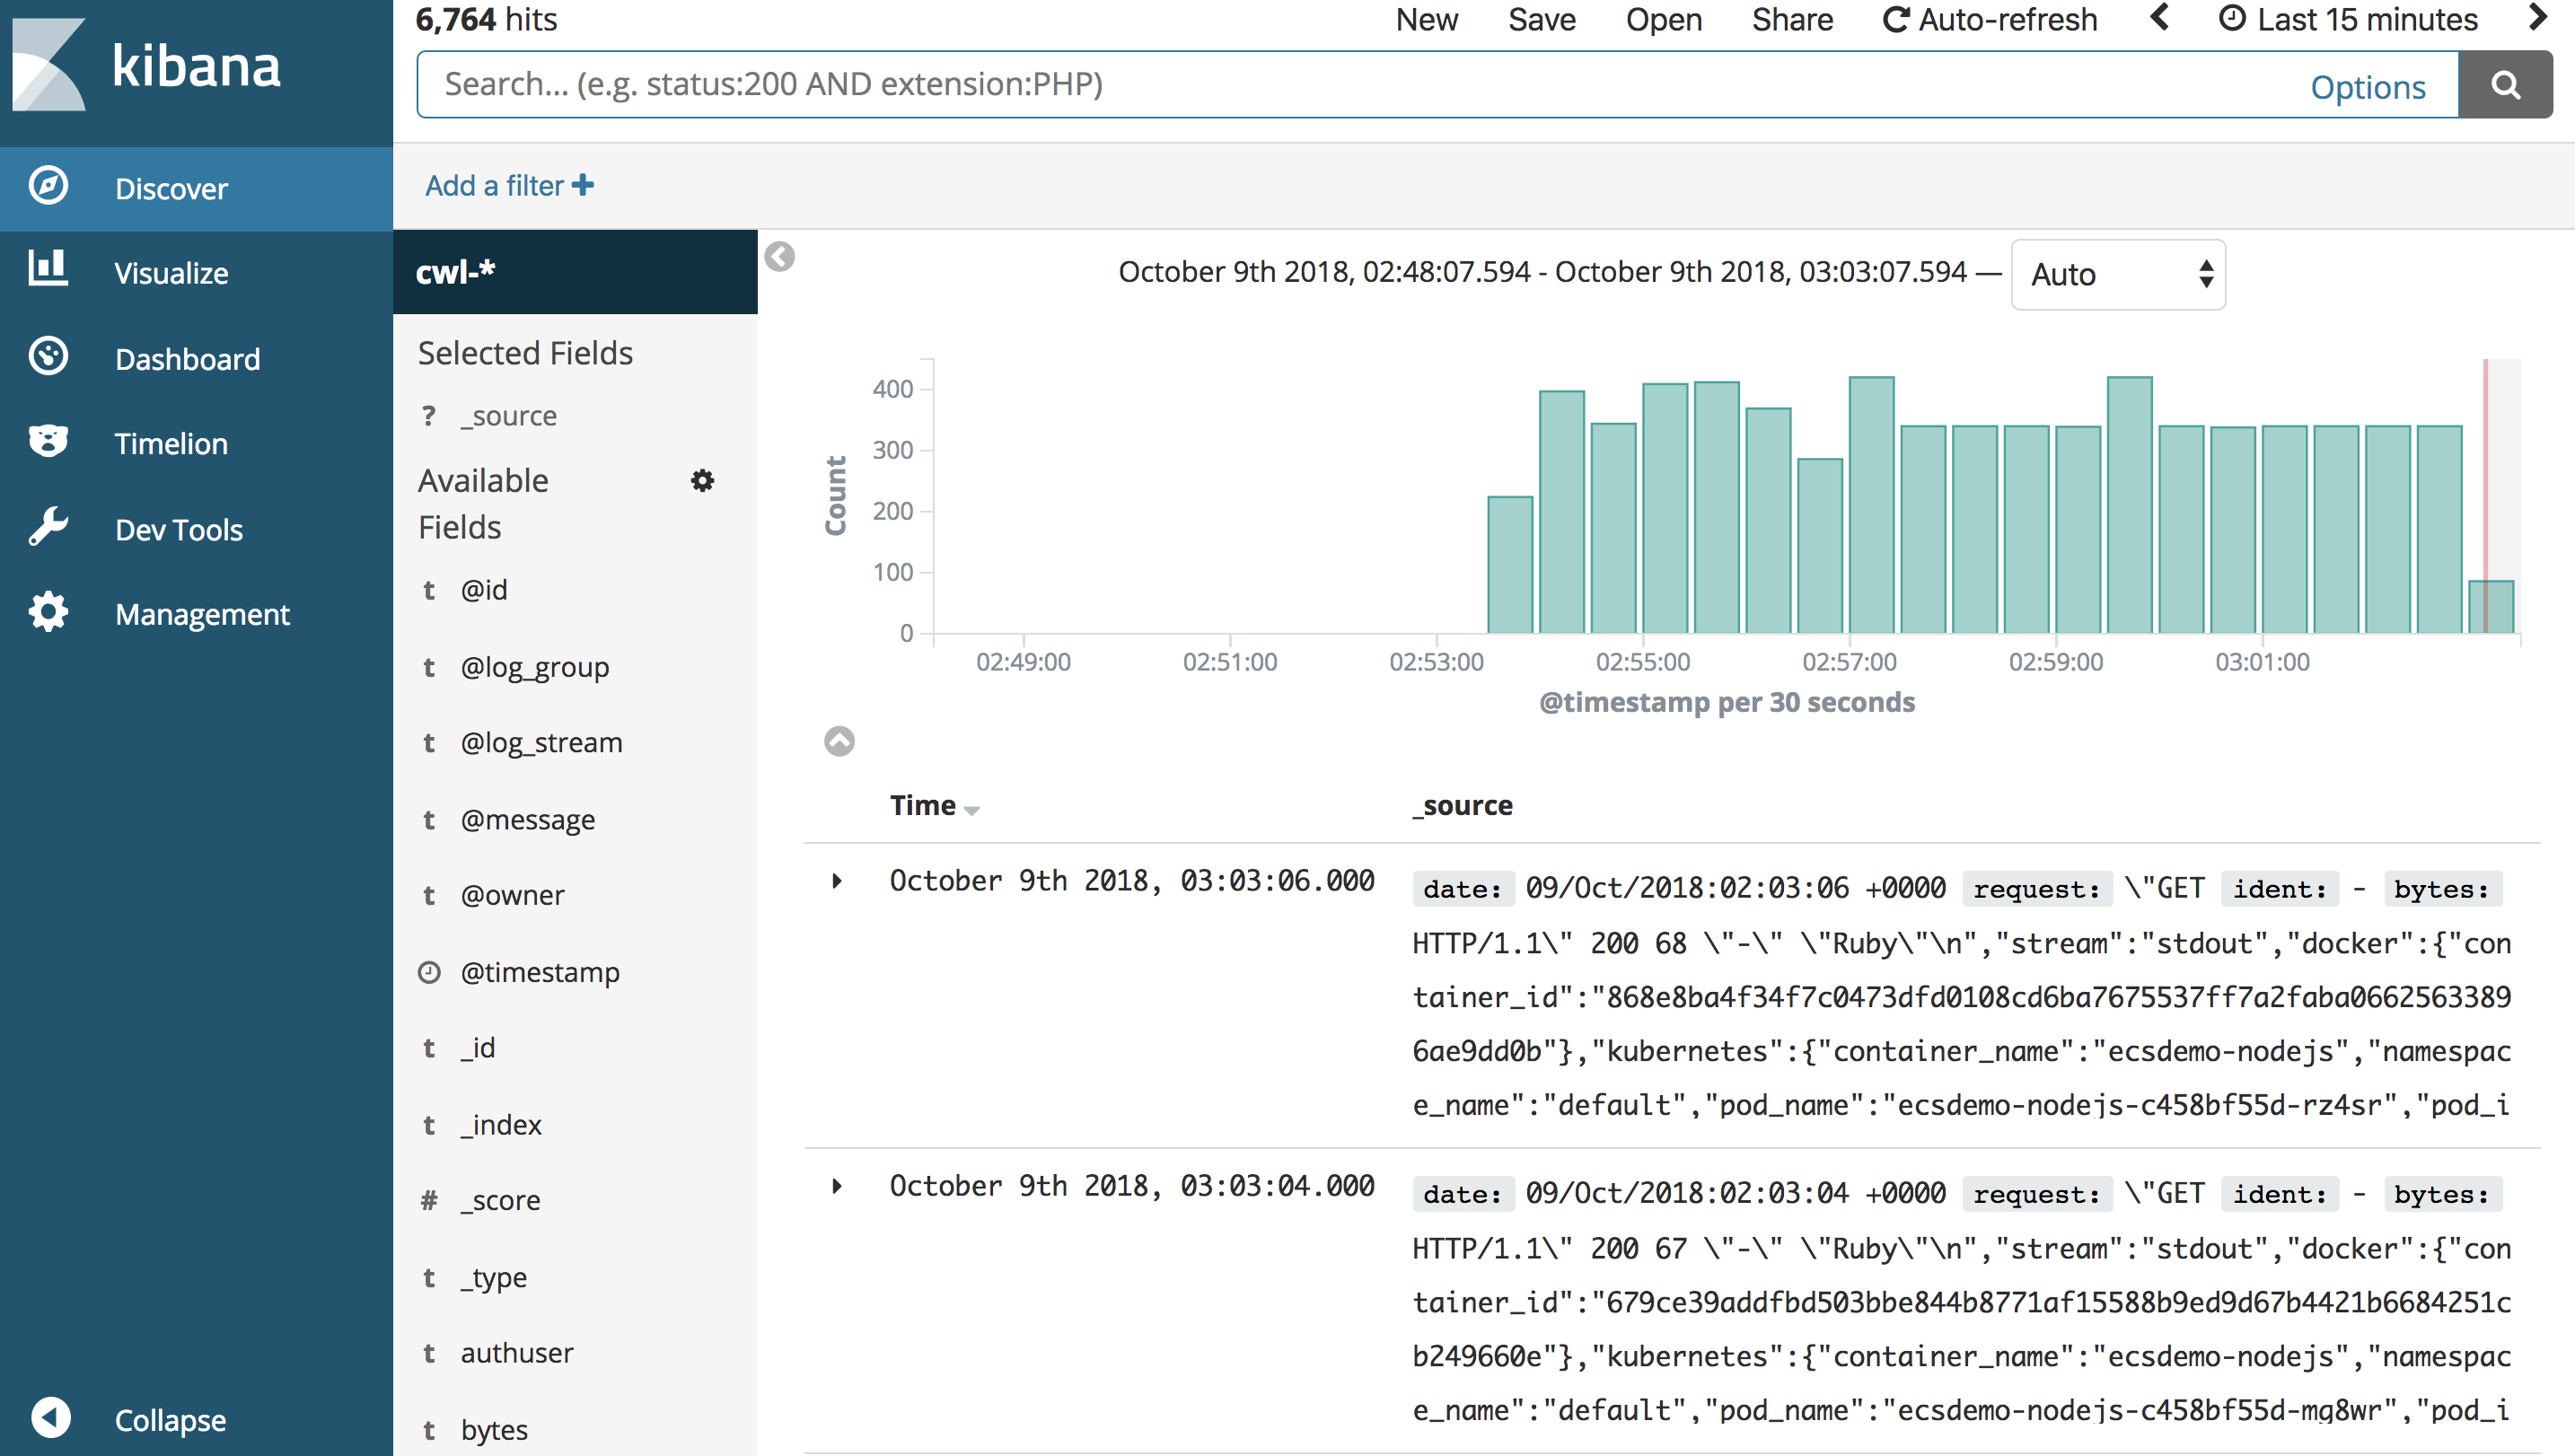
Open the Kibana dashboard from the link. After a few minutes, records will begin to be indexed by ElasticSearch. You’ll need to configure an index patterns in Kibana.
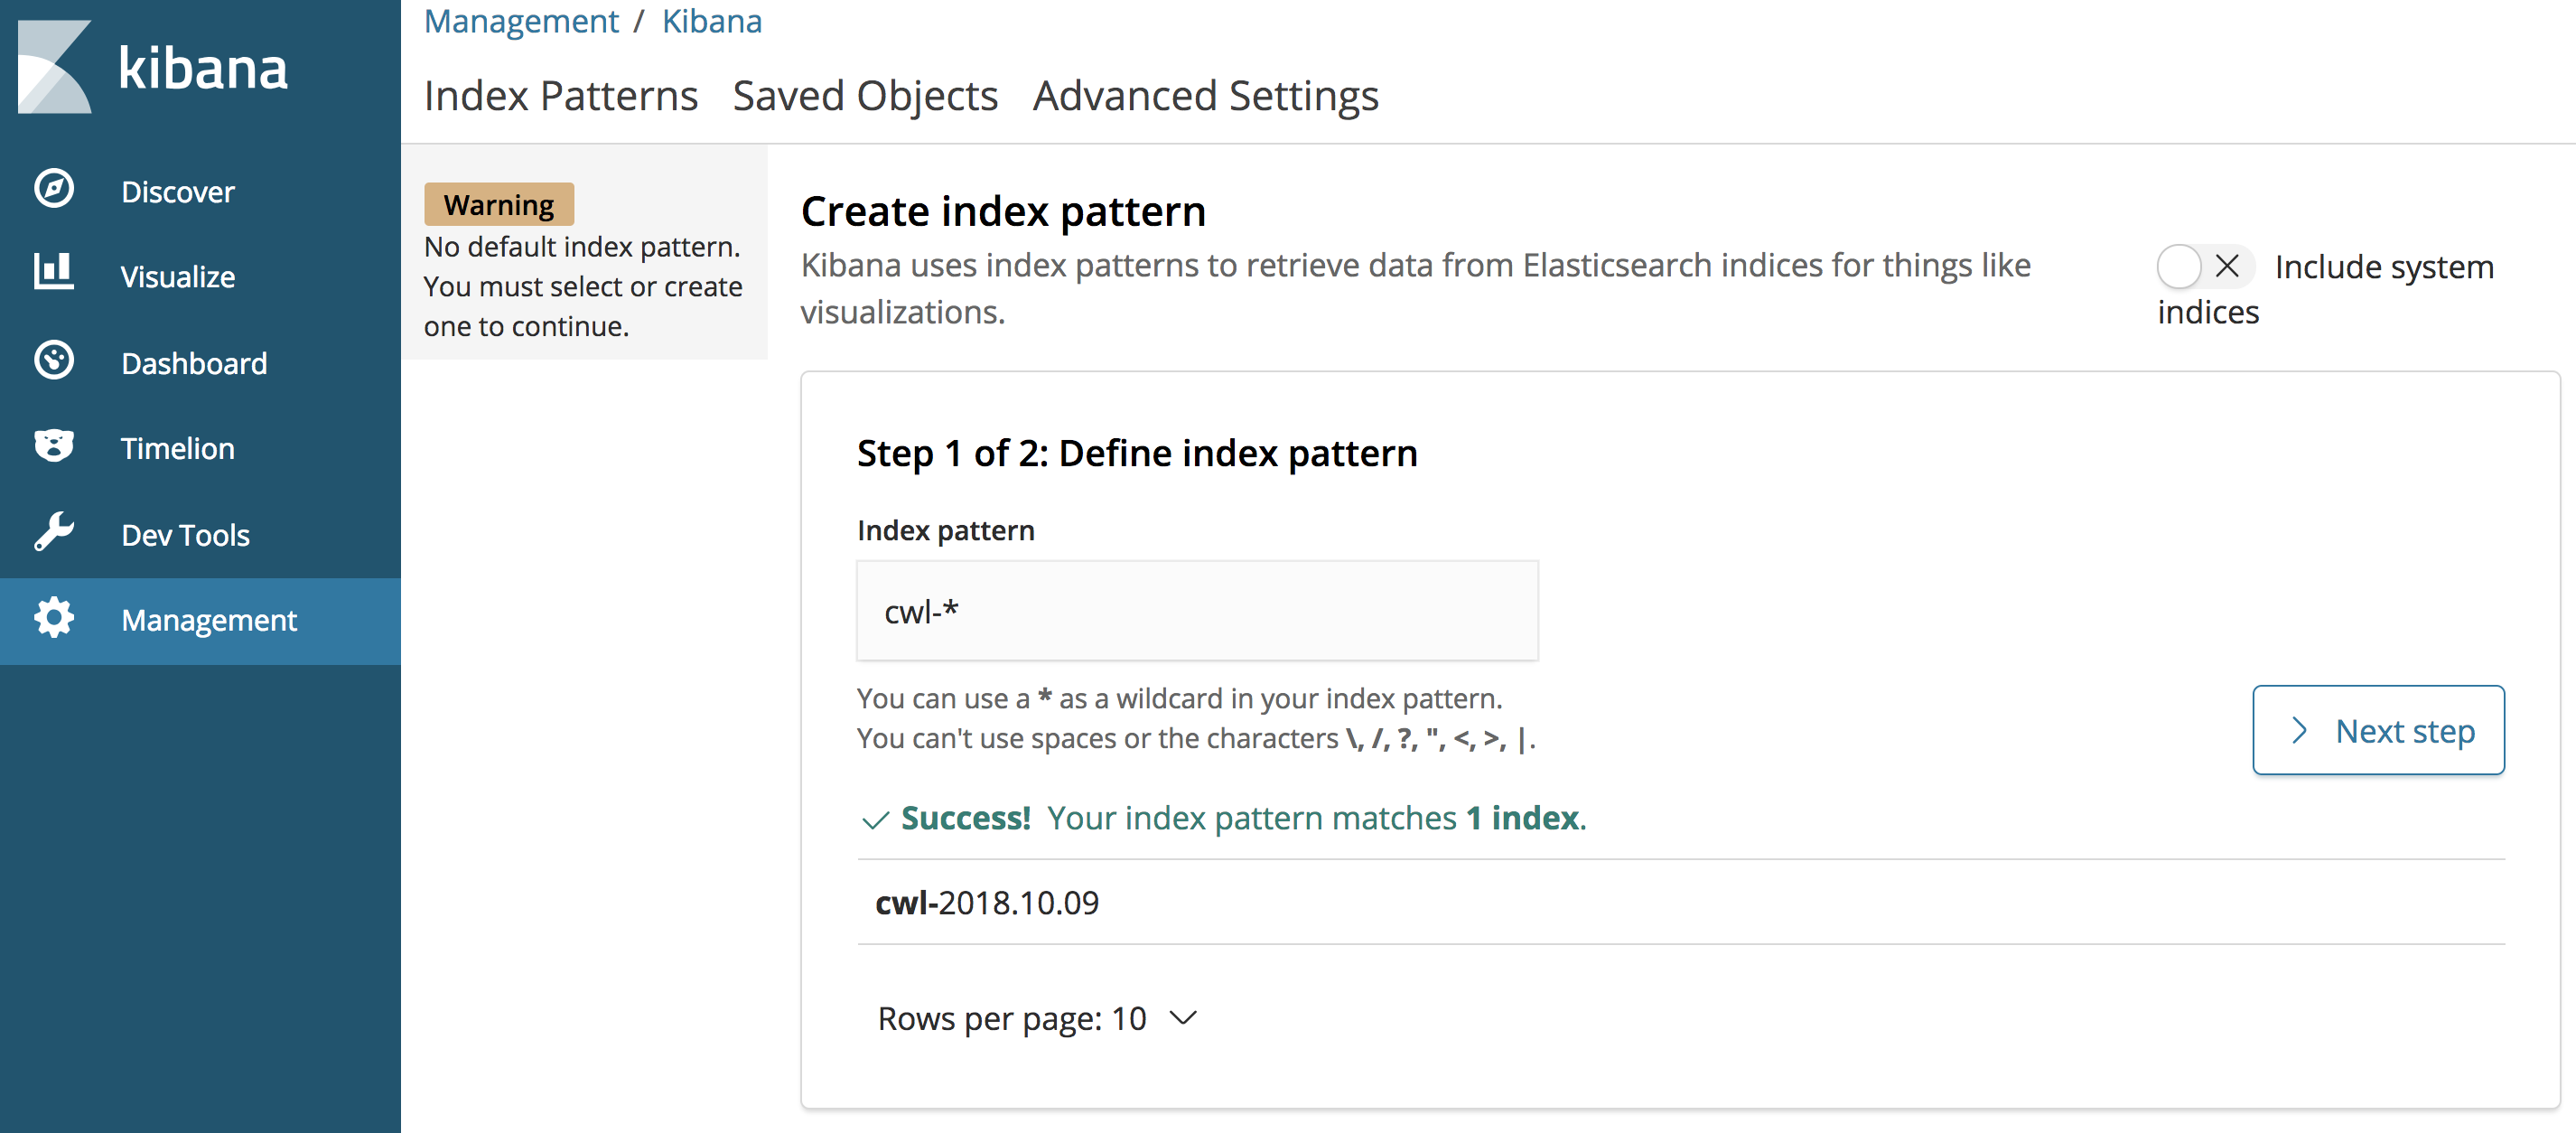
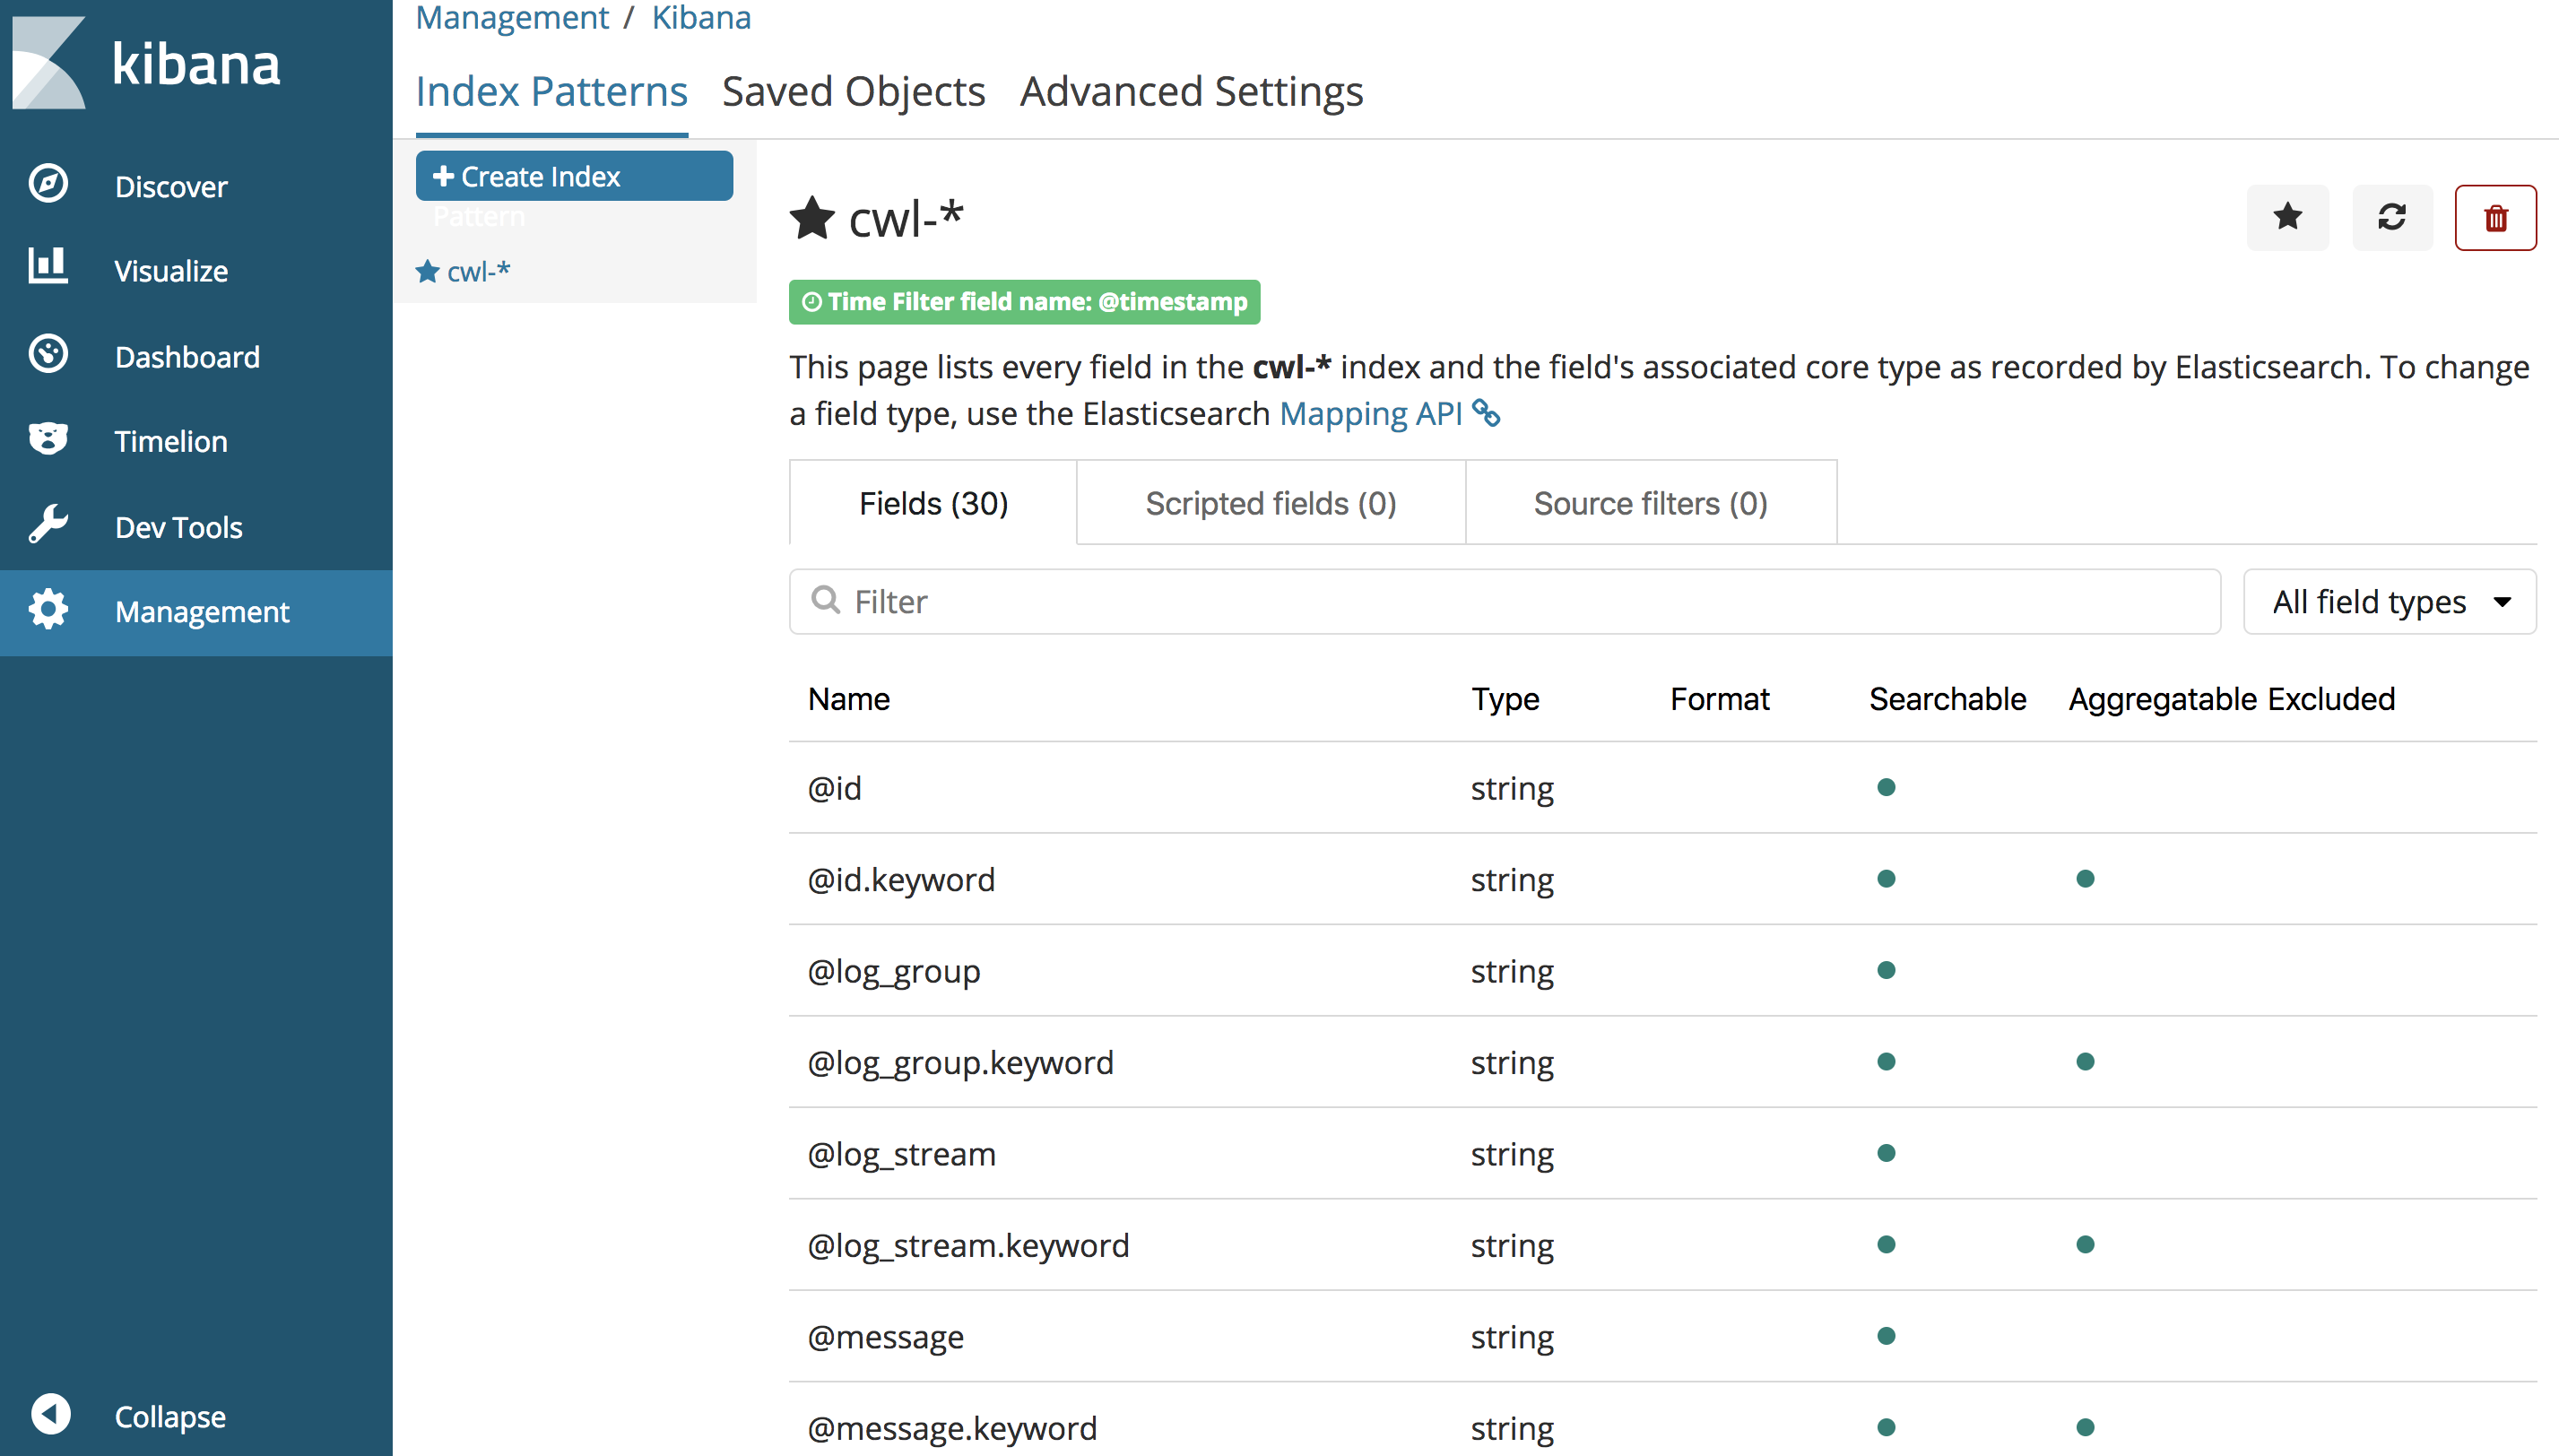
Set Index Pattern as cwl-* and click Next
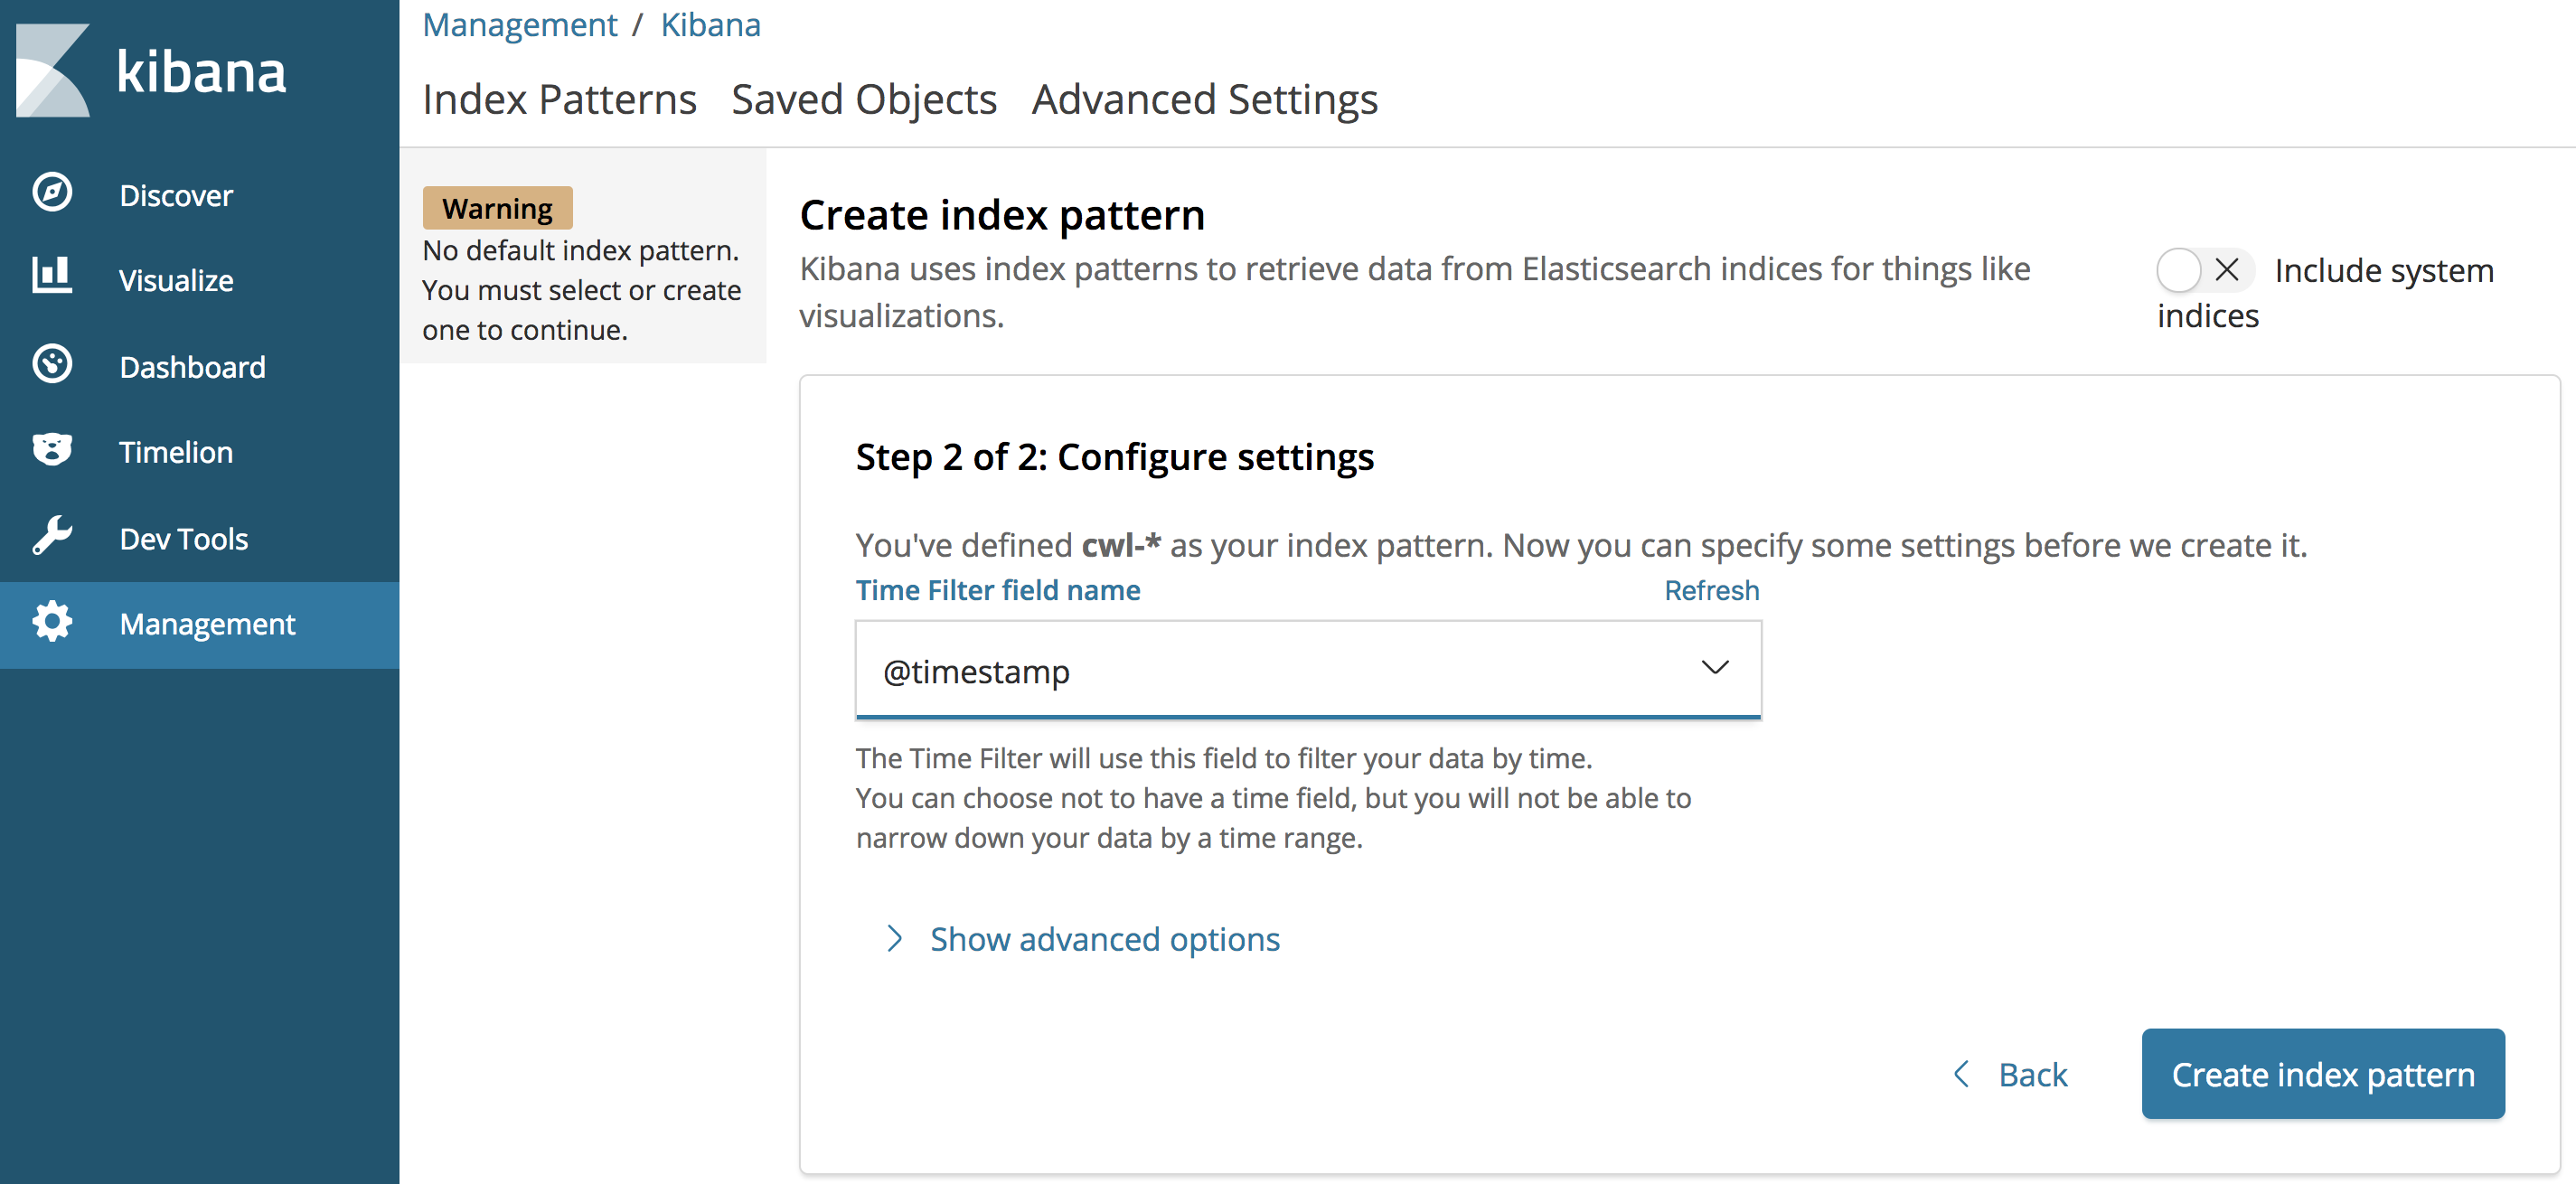
Select @timestamp from the dropdown list and select Create index pattern
Click on Discover and explore your logs