Deploy Prometheus
Deploy Prometheus
First we are going to install Prometheus. In this example, we are primarily going to use the standard configuration, but we do override the storage class. We will use gp2 EBS volumes for simplicity and demonstration purpose. When deploying in production, you would use io1 volumes with desired IOPS and increase the default storage size in the manifests to get better performance. Run the following command:
kubectl create namespace prometheus
helm install stable/prometheus \
    --name prometheus \
    --namespace prometheus \
    --set alertmanager.persistentVolume.storageClass="gp2" \
    --set server.persistentVolume.storageClass="gp2"
Make note of the prometheus endpoint in helm response (you will need this later). It should look similar to below:
The Prometheus server can be accessed via port 80 on the following DNS name from within your cluster:
prometheus-server.prometheus.svc.cluster.local
Check if Prometheus components deployed as expected
kubectl get all -n prometheus
You should see response similar to below. They should all be Ready and Available
NAME                                                 READY     STATUS    RESTARTS   AGE
pod/prometheus-alertmanager-77cfdf85db-s9p48         2/2       Running   0          1m
pod/prometheus-kube-state-metrics-74d5c694c7-vqtjd   1/1       Running   0          1m
pod/prometheus-node-exporter-6dhpw                   1/1       Running   0          1m
pod/prometheus-node-exporter-nrfkn                   1/1       Running   0          1m
pod/prometheus-node-exporter-rtrm8                   1/1       Running   0          1m
pod/prometheus-pushgateway-d5fdc4f5b-dbmrg           1/1       Running   0          1m
pod/prometheus-server-6d665b876-dsmh9                2/2       Running   0          1m

NAME                                    TYPE        CLUSTER-IP       EXTERNAL-IP   PORT(S)    AGE
service/prometheus-alertmanager         ClusterIP   10.100.89.154    <none>        80/TCP     1m
service/prometheus-kube-state-metrics   ClusterIP   None             <none>        80/TCP     1m
service/prometheus-node-exporter        ClusterIP   None             <none>        9100/TCP   1m
service/prometheus-pushgateway          ClusterIP   10.100.136.143   <none>        9091/TCP   1m
service/prometheus-server               ClusterIP   10.100.151.245   <none>        80/TCP     1m

NAME                                      DESIRED   CURRENT   READY     UP-TO-DATE   AVAILABLE   NODE SELECTOR   AGE
daemonset.apps/prometheus-node-exporter   3         3         3         3            3           <none>          1m

NAME                                            DESIRED   CURRENT   UP-TO-DATE   AVAILABLE   AGE
deployment.apps/prometheus-alertmanager         1         1         1            1           1m
deployment.apps/prometheus-kube-state-metrics   1         1         1            1           1m
deployment.apps/prometheus-pushgateway          1         1         1            1           1m
deployment.apps/prometheus-server               1         1         1            1           1m

NAME                                                       DESIRED   CURRENT   READY     AGE
replicaset.apps/prometheus-alertmanager-77cfdf85db         1         1         1         1m
replicaset.apps/prometheus-kube-state-metrics-74d5c694c7   1         1         1         1m
replicaset.apps/prometheus-pushgateway-d5fdc4f5b           1         1         1         1m
replicaset.apps/prometheus-server-6d665b876                1         1         1         1m
In order to access the Prometheus server URL, we are going to use the kubectl port-forward command to access the application. In Cloud9, run:
kubectl port-forward -n prometheus deploy/prometheus-server 8080:9090
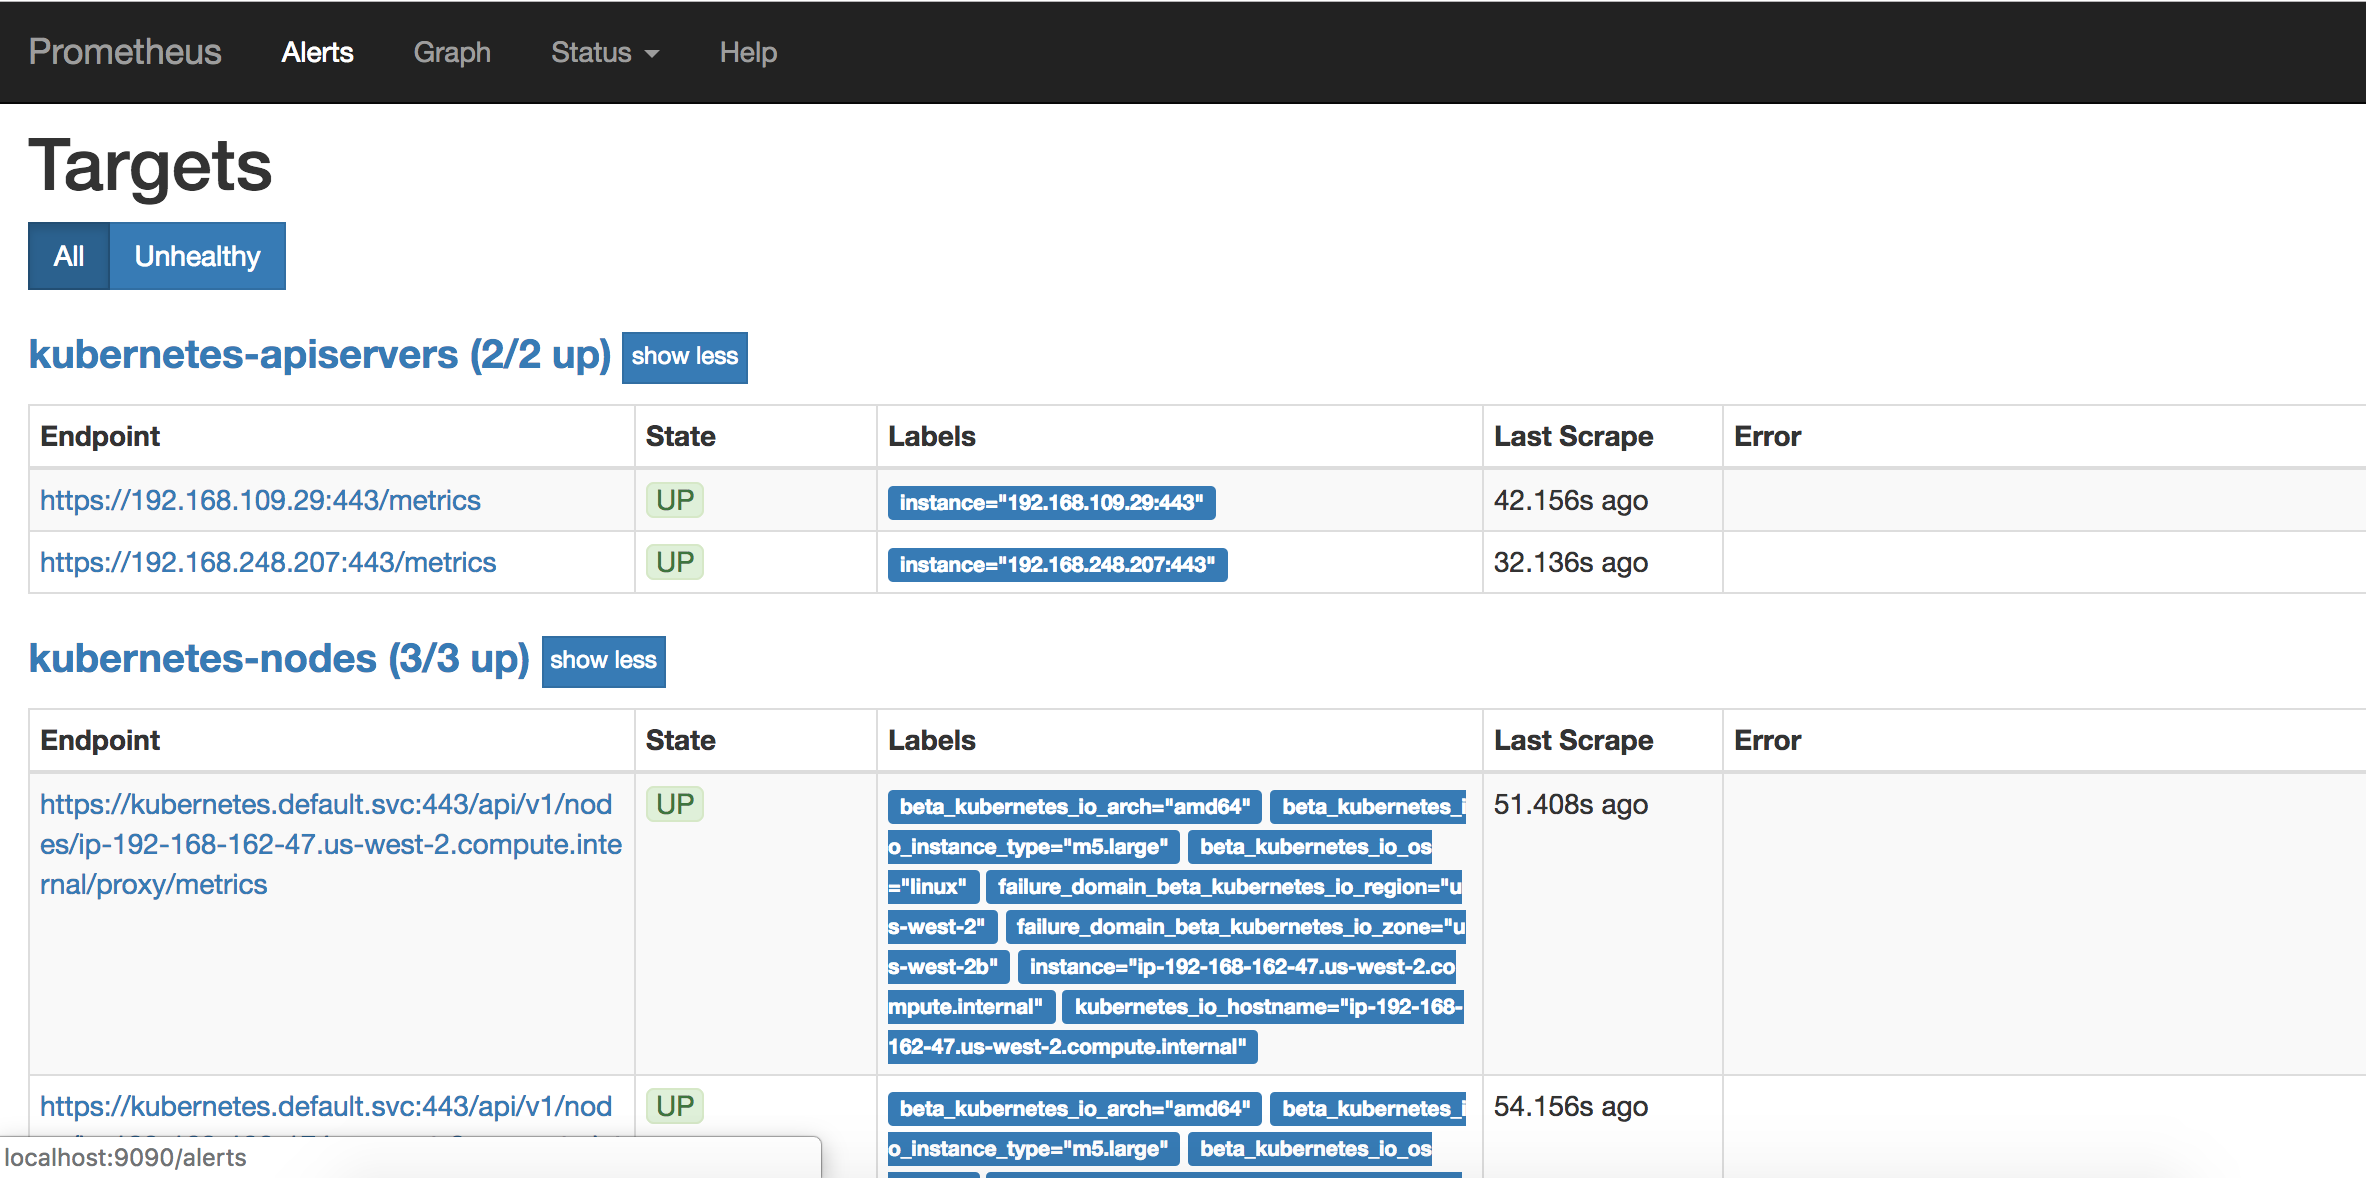
In your Cloud9 environment, click Tools / Preview / Preview Running Application. Scroll to the end of the URL and append:
/targets
In the web UI, you can see all the targets and metrics being monitored by Prometheus: